|
|
Using RAM Analysis to reduce turbine-generator maintenance costs |
|
Editor's note: RAM is an acronym for 'reliability, availability
and maintainability'. RAM analysis is a technique used in some
nuclear generating stations to improve a plant maintenance program
(see Maintenance mathematics). Of interest to engineers
who maintain any complex electro-mechanical-chemical system,
this article takes RAM analysis a step further. Although it applies
to turbine-generators, it can be applied to any major installation:
oil refineries, ocean drilling rigs, steel mills, complex
production lines, hydro, nuclear and fossil-fuelled thermal generating
stations.
The cost of maintenance varies widely from one generating
station to another. This holds true even when comparing stations
with similar generating output capacities. And cost is the vital
factor in maintaining equipment capability or, put in another
way, reducing the incapability factor.
RAM techniques were
applied to turbine-generator systems at the Bruce nuclear generating station
in Ontario, Canada. As a general rule, in any complex system, 20 per cent of
the installation take 90 per cent of the maintenance budget to maintain. The
aim therefore was to separate those items of equipment that require the lion's
share of attention. After this was done, the planners specified those tasks
that would improve the effectiveness of the turbine-generation maintenance
program.
|
|
|
The North American Electric
Reliability Council (NERC) equipment incapability factor (EICbF) standard
(see the boxed definition) for turbines over the five-year period 1984-1988
was about 9 per cent. Over the same period, the turbine EICbF for the four
832-MW units at Bruce A Nuclear Generating Station was 8 per cent. The performance
for the turbines of the station was therefore only marginally better than the
industry standard.
The equipment incapability
factor for the station's generators over the same 5-year period
was 5 per cent as compared to the NERC standard of 3.5 per cent.
Performance of the generators was obviously well below standard
and a threat to reliability. To improve the turbine generator
maintenance program, analysis of the main components began
with a definition of the boundaries and interfaces between the
systems and subsystems.
|
Equipment incapability factor (EICbF) is a measure of the contribution
that an item of equipment or system would have made to a unit's
gross ICbF if all other system had operation perfectly during
a specific period.
Gross incapability factor (ICbF) is the percentage of gross
generation that a unit is capable of producing in a specific
period.
Poisson distribution theory was developed by Simeon-Denis
Poisson (1781-1840), a French mathematician famous for his
work on definite integrals and probability analysis. |
 |
|
|
|
Dominant failure modes
With the main components and subsystems identified (see Figure
1 and Table 1), the next step was to conduct a failure mode and
effect analysis (FMEA). The purpose of a FMEA was to categorize
all possible failure modes, and the effects of such failures
on the availability of the component or system under review.
This is one RAM technique; fault tree analysis is another.
In this study, fault tree analysis was used
to assess the most critical of all possible failure modes. The
assessments resulted in the truth table shown in Table 1. From
this data the probability of the overall system failure was calculated.
[The following may look complicated, but consult Table
1 and the equation will is logically assembled.]
|
 |
|
|
|
|
Equation 1 where the symbol | = given that
P (failure) = P[SG] + P[TG|SG] + P[ESV] + P[TG|ESV]
+ P[ESV|LO] + P[GSV] + P[GSV|LO] + P[TG|GSV]
+ P[RIV] + P[RIV|LO] + P[TG|RIV] + P[TG] + P[TG|CD]
+ P[CD] + P[LO] + P[TG|LO] + P[EX] + P[TG|EX] + P[HX]
+ P[TG HX]
Applying conditional probability rules, Equation 1 is expanded
to
Equation 2 where the symbol ∩ = intersection
P (failure) = P[SG] + P[TG ∩ SG]/P[SG] + P[ESV] + P[TG ∩ ESV]/P[ESV]
+
P[ESV ∩ LO]/P[LO] + P[GSV] + P[GSV ∩ LO]/P[LO] + P[TG ∩ GSV]
/P[GSV] + P[RIV] + P[RIV ∩ LO]/P [LO] + P[TG ∩ RIV]/P[RIV]
+ P[TG] + P[TG ∩ CD]/P[CD] + P[CD] + P[LO] + P[TG ∩ LO]/P[LO]
+ P[EX] + P[TG ∩ EX]/P[EX] + P[HX] + P[TG ∩ HX]/P[HX]
The probability of individual component failure was then calculated
using Poisson logic.
Equation 3
Pt (failure) = 1-e-λt where Pt is the time dependent
failure probability and the failure rate.
To calculate the failure probabilities of the subsystems,
it is necessary to have values of λ for the individual
components and the joint failure events. This raises the question
of how to get accurate values of λ, which is a problem.
Computer simulations may be useful, but the reliability of
simulated data is doubtful and may even be misleading. It is
better to rely on production and maintenance records, provided
they are accurate and well maintained.
Maintenance records
should include the following minimum information
- Failure mode
and diagnosis of the component or system.
- Other
components that failed as a result of the primary component
or system failure.
- The effect of the failure on production
or plant capability.
- Repair and replacement time including
work hours and material used.
- Annual frequency of
failure figures and cumulative figures over the service life
of the component.
- The cost of repair and the total outage time.
|
|
Figure 1 is a simplified goal tree for the turbine-generator.
Goal tree analysis provides some measure of the production and
maintenance tasks that must be done to achieve the objective.
For example, one objective might be to maximize equipment
availability. Another could be to improve overall production
efficiency. In the case of the turbine-generator studied,
the primary objective was to maximize its availability for service. |
|
|
|
|
Maintenance tasks
The final phase of the analysis was to determine the most cost effective
maintenance tasks and to incorporate them in the program. As noted,
FMEA identifies the dominant failure modes of components
or subsystems. Using this information and reviewing the preventive
maintenance program leads to program changes that improve cost effectiveness.
It also offers a number of options, which are to: do nothing; replace
the equipment; make design changes; improve the spare parts program;
revise the operating and maintenance procedures; provide additional
training; or improve the operating environment.
Subsystem criticality ranking
The next logical step is to rank the system elements in order
of diminishing criticality. Ideally, to minimize the incidence of
failure, it is necessary to maximize component maintenance. Unlimited
maintenance is impractical, for it would increase the work load beyond
the capacity of the maintenance staff to say nothing of the exorbitant
cost.
|
|
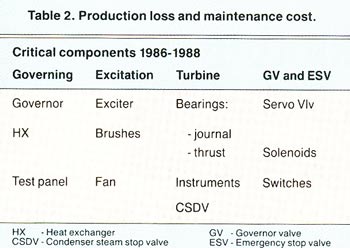
If a unit
is to operate efficiently, the system components must be ranked to get the
maximum benefit from the maintenance effort. Criticality ranking requires reliable
data that can only come from accurate production and maintenance records.
Table 2 is a list of the Turbine-generator subsystems based on two criteria,
which are 'loss-of-production costs' and 'maintenance time spent on the
equipment'.
Maintenance planning
Planning a maintenance strategy and applying it is easy once the
critical components of the system are known. In sum, the strategy
can be expressed in a syllogism: |
 |
|
|
|
- Failure of critical equipment is intolerable.
- Therefore, minimize
breakdown maintenance.
- Expand preventive maintenance to minimize
equipment breakdown.
Bearing failure, for example, is critical. RAM analysis
confirmed this. Methods used to detect impending bearing failure
are first, on-load vibration monitoring and, secondly, lubrication
condition monitoring. On the basis of these conclusions, the
station management decided to replace its 10-year-old vibration
monitoring equipment.
RAM analysis led to
a number of steps taken to improve equipment availability. One was to
refurbish and, where it was considered necessary, to replace the condenser
steam discharge valves. Another centered on the quality of the station's maintenance
procedures. Those for the Turbine-generators and their subsystems were
rewritten in plain English, which made them less complicated to read and follow.
As a result, less time was spent in finding spare parts and the actual maintenance
was done more efficiently.
The RAM analysis and
conclusions reached led to a number of changes in maintenance practice. These
included:
- Systematic condition monitoring of bearings was begun;
- Improved
maintenance of the condenser steam discharge valves was instituted;
- The
station began a program of revised all its maintenance procedures.
- Using
PC-based planning software, detailed outage plans for the turbine-generators
with clear references to the new maintenance procedures were
introduced. This made for more efficient manpower planning
and shortage outage times.
- The station management introduced manufacturer
training for maintenance staff. For example, the cost of exciter
maintenance was high because the repair crews lacked maintenance
expertise. The same applied to fitters and mechanics for maintaining
motor-operated valves and like equipment.
- Design changes to
the exciter cooling system were made with considerable cost
savings.
- The
analysis pointed to the need to investigate other component
failures including servo-valves, solenoid valves, limit switches
and the electro-hydraulic governor system test panel.
|
|
|
Conclusions
Effective maintenance improves equipment availability and reduces
costs. Equipment availability and cost saving was the primary
aim of the study.
RAM analysis requires
a logical approach to the problem through the use of techniques such as FMEA,
FTA and goal trees. To illustrate the steps of this method of analysis use
was made of a simplified turbine-generator system. This was ranking critical
components in terms of the severity of failure.
|
 |
|
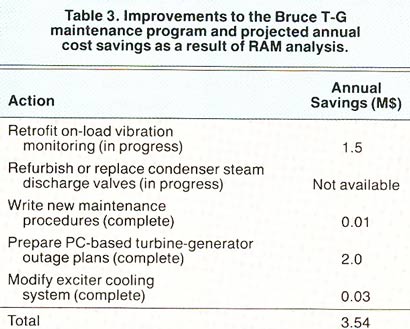
On the basis of ranking, it is possible
to assign the preventive maintenance tasks in order of priority.
The analysis also led to additional options including writing clear
procedures, developing detailed outage plans and better management
of spare parts. Table 3 lists the projected cost saving for the
period for which the analysis was done. These savings lead to an
important observation, which is that more than half of savings
come from better documentation – new procedures and better
outage plans – to a total of $2.01 million.
Finally, equipment availability is increased
and maintenance costs decreased by the use of logical analysis
using RAM techniques for any complex system of electro-mechanical
plant or chemical processing installation.
Co-authored with I. Walker, P. Eng. (First published in Power Engineering July 1990)
|
References
Probability and Statistics for
Engineers, I. Miller and J. Freeund, 2nd Edition, Prentice-Hall,
1977.
RAM Applications in Power Generation; A tutorial held
at the 14th InterRam Conference held in Toronto, Ontario, May
1987.
|
|
|
|
| |
|
|
|
|
|